The International Bottled Water Association (IBWA) (bottledwater.org) has released a new infographic setting the record straight about landfill space and environmental footprint of PET plastic bottled water containers.
“On social media and in the blogosphere, reports continue to errantly perpetuate the idea that bottled water packaging is clogging up U.S. landfills,” says Chris Hogan, IBWA vice-president communications. “So, IBWA decided to put bottled water packaging to the test, comparing our packaging, side-by-side, against the oth¬er most common types of beverage con¬tainer packaging.”
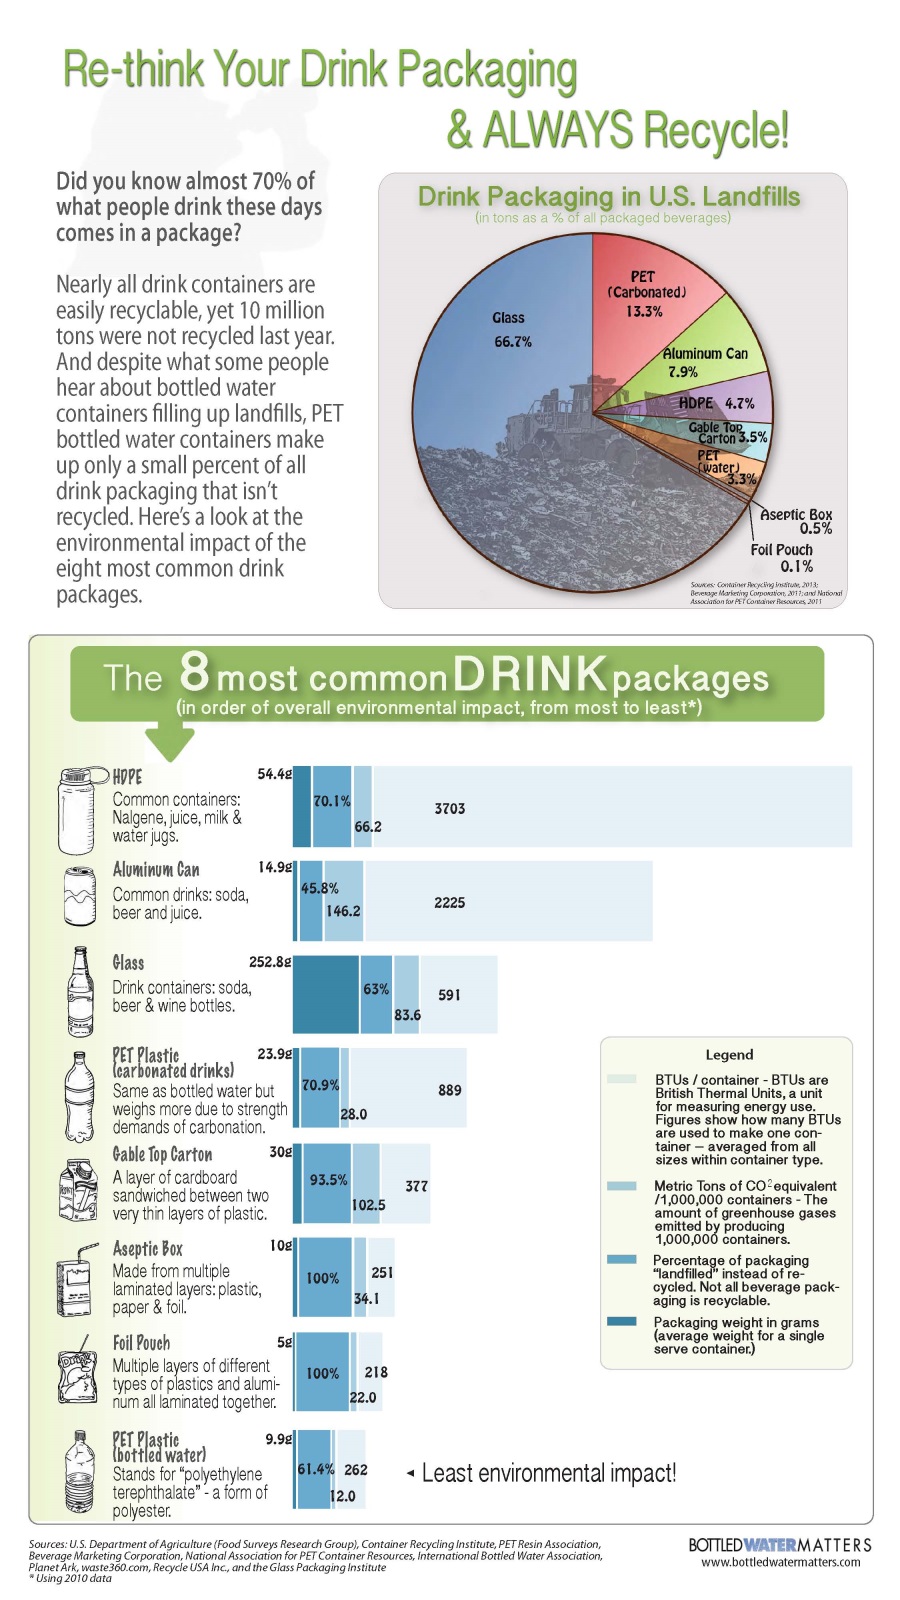
“When you do this, you see that bottled water containers, measured in tons of landfill space, make up just 3.3% of all beverage containers that end up in landfills. The waste percentage numbers are much higher for the glass (66.7%), aluminum (7.9%), and soda bottles (13.3%) that end up in landfills.”
Data for Bottled water PET containers was put up against:
• PET for carbonated beverages,
• aluminum cans,
• glass bottles,
• cardboard cartons,
• foil pouches,
• aseptic boxes, and
• HDPE jugs and reusable containers.
“First, we examined the “tons” of mismanaged packaging—i.e., the containers that go into landfills instead of being recycled,” says Mr. Hogan. “Its important to note here that nearly all beverage containers are 100 percent recyclable and should be recycled, not placed in landfills.”
According to the most current data from the Container Recycling Institute’s (CRI) signature analysis of beverage container sales and recycling rates, Bottled Up (2000-2010): Beverage Container Recycling Stagnates, 9.315 million tons of beverage container packaging was “wasted”—i.e., ended up in landfills—in 2010. But within that number, PET containers for bottled water, with an average weight of 9.89 grams, make up only 0.308 million tons. PET for carbonated drinks packaging weigh considerably more (23.9 grams) due to the need to use heavier plastic for carbonation—and thus totaled 1.239 million tons. (In October 2015, Beverage Marketing Corporation published data showing that from 2000-2014 the average weight of a 16.9 ounce single-serve PET plastic water bottle declined 51 percent to 9.25 grams.
“Bottled water’s critics also commonly misrepresent environmental facts when they want to disparage bottled water products,” says Mr. Hogan. “In one often-seen example, they cite energy use and greenhouse gas emissions numbers, comparing bottled water packaging to oil use and car emissions.”
“Again, we researched the facts to compare bottled water’s PET containers against the previously identified seven most common drink packages. The quest was to determine the environmental impacts of each packaging type.”
“Using the CRI report, we discovered that PET plastic for bottled water containers has the smallest footprint when you consider energy used to make the container, greenhouse gas emissions, and recyclability rate. While foil pouches and aseptic boxes use slightly less energy to make, both of those packaging types are not easy to recycle—and in some locations they are impossible to recycle, sending nearly all of these post-consumer drink packages to the landfill. Thus, we made a very slight “environmentally unfriendly” adjustment for foil pouches and aseptic boxes.”
Mr. Hogan said articles misrepresenting bottled water’s impact on the environment were too numerous to count and often fueled by campaigns of misinformation organized by anti-corporation adversaries.
“We’re hoping this new infographic will help get the fact out to consumers up so that they can make smart choices about packaged beverages,” he says.
“We hope that people will help us spread the truth about bottled water’s recyclability and environmental impact.”