
As the Packaging Strategies ranking of the largest beverage packaging companies demonstrates, the big just keep getting bigger. Since its merger with SAB Miller in late 2016, Anheuser-Busch InBev has become the undisputed king of the beverage world, leading the list for the second year in a row with reported revenues of $56.44 billion, well above its 2016 revenues of $45.52 billion.
Based on beverage sales alone, the rest of the top four maintained the same order—The Coca-Cola Co ($35.41 billion), PepsiCo Inc. ($29.85 billion) and Nestlé SA ($29.11 billion)—while the Japanese spirits giant Suntory Holdings ($22.05 billion) edged Heineken ($21.88 billion) for the fifth spot. It should be noted that Nestlé and PepsiCo, whose sales also include substantial food product lines, have much larger total revenues. These rankings are based primarily on beverage sales, exclusive of food revenues where we were able to identify the differences.
Click Here for The 2018 Top 25 Beverage Packaging Companies Rankings
Recent studies show that global demand for packaged beverages is growing rapidly, especially in developing countries. The global beverage packaging market is expected to reach $173.26 billion by 2025, according to a report by Grand View Research (grandviewresearch.com), progressing at a CAGR of 4.5 percent in the next five years.
Beverage companies are seeing major shifts in consumer beverage consumption. For many years, carbonated sodas were the preferred beverage. However, with increasing health concerns about sugars, many consumers are switching to bottled waters and functional beverages.
WATER FLOODS THE MARKET
Bottled water is the No. 1 beverage product in the U.S. by volume for a second year in a row, according to a recent report by the International Bottled Water Association (bottledwater.org) and the Beverage Marketing Corp. (BMC, beveragemarketing.com). Nestlé, PepsiCo and Coca-Cola all have major product lines in bottled water.
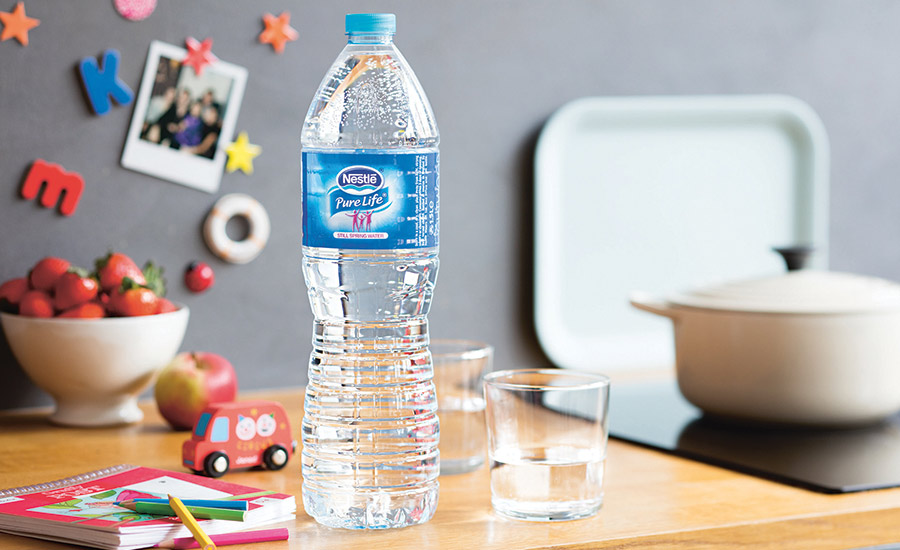
The distance between bottled water and carbonated soft drinks continues to widen as consumers increasingly choose bottled water instead of soda. Carbonated soft drink sales decreased for the 13th consecutive year, according to the most recent numbers from BMC. Bottled water sales now total $18.5 billion, an increase of 8.8 percent. Per capita consumption exceeds 42 gallons of bottled water, a 6.2 percent increase. Meanwhile, the average annual intake of carbonated soft drinks has slipped to 37.5 gallons, BMC statistics show.
Although there has been a persistent decline in carbonated soft drinks, BMC’s DrinkTell database indicates that Americans are not shunning carbonation completely. Consumption of sparkling bottled water and energy drinks is increasing dramatically. PepsiCo recently launched its Bubbly brand of seltzer waters and LaCroix (not on the Top 25 list) has made major inroads into the U.S. market.
TOUGH TIMES BREWING
Major beer brands have struggled to hold on to consumer loyalties. According to BeerBoard (beerboard.com) a company that monitors the beer industry, consumption of Budweiser, Miller and Coors slipped to 49.59 percent of the U.S. market, a two-point decline that showed up directly as an increase to craft beer’s share (35.9 percent). To counter this stagnation, the majors have resorted more frequent updates to their packaging, along with use of active packaging to increase engagement with consumers. In addition, the international conglomerates are stepping up acquisitions of smaller, independent breweries.
Another major change in the beverage market is the move toward functional beverages as consumers strive to improve the health. The rise of clean-label, non-GMO, organic and better-for-you products are impacting purchase behaviors across generations. Innova Market Insights (innovadatabase.com) places this action as one of the top two trends in the beverage marketplace for 2018.
In its 2017 “Functional Drinks” report, the market research firm reports that 27.2 percent of all beverages launched globally in 2016 featured functional benefits, rising at a compound annual growth rate of 12.6 percent between 2012 and 2016. In 2017, 30.5 percent of all functional drink launches were vitamin/mineral fortified, while 22.8 percent contained high amounts of protein. Rounding out the Top 5 were energy/alertness (20 percent), digestive/gut health (19 percent), and antioxidants (12.7 percent).
According to Grand View Research, bottles and jars were the largest beverage packaging segment in 2016. However, cartons will likely witness promising growth for the several years due to burgeoning adoption of active packaging. It helps in extending shelf life of products by using several systems such as moisture absorbers, oxygen scavengers, antioxidants and antimicrobial agents.
JARS AND BOTTLES STILL ON TOP
The bottles and jars typically use glass and plastic materials. The demand for plastic bottles is directly supported by rising consumption of bottled drinking water and carbonated soft drinks, the report states. High-density polyethylene (HDPE) and polyethylene terephthalate (PET) are among the most com grades of plastics utilized to manufacture plastic bottles. Exponential growth in the single-serve water packaging is likely to expand the demand for plastic bottles, although there is also increasing demand to limit single-use plastic containers.
In late January 2018, Coca-Cola announced plans to help collect and recycle 100 percent of its bottles and cans by 2030 and has a goal of 50 percent recycled content for its bottles. In 2017, PepsiCo announced plans to make 100 percent of its packaging recyclable or recoverable by 2025. In its Evian bottles, Danone is already using 25 percent recycled contents and has announced plans to be 100 percent recycled by 2025.
Top 25 Archives
2017 | 2016 | 2015 | 2014 | 2013 | 2012 | 2011
More Top Beverage Packaging Companies Resources
