FLEXIBLE PACKAGING ASSOCIATION | UPDATE
FPA Releases 2013 State of the Flexible Packaging Industry Report
The Flexible Packaging Association recently published its 2013 State of the U.S. Flexible Packaging Industry Report, which provides an overview of the performance of the U.S. flexible packaging industry and the “value added” segment of the industry in 2012.
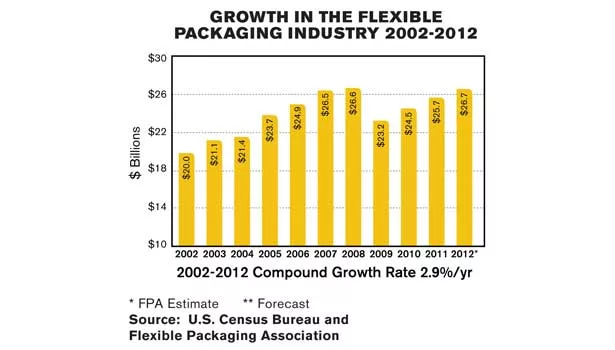
The Report indicates that the U.S. flexible packaging industry experienced positive growth, with annual sales increasing to $26.7 billion in 2012 from $25.7 billion in 2011. Today, the U.S. flexible packaging industry represents 18 percent of the $145 billion U.S. packaging industry and remains the second largest packaging segment. The Report also examines the value added segment, which enhances flexible materials by performing multiple processes such as extrusion, lamination and printing. This segment represents $20.9 billion of annual U.S. flexible packaging industry sales.
The State of the U.S. Flexible Packaging Industry Report is a definitive source of information regarding industry size, structure, market segments, and key packaging products. Data in the Report is based on primary research including surveys of FPA members including flexible packaging converters and material/equipment suppliers. Survey participants represent 72 percent ($15 billion) of the $20.9 billion value added segment, which includes retail and institutional packaging, industrial materials, shrink wrap and stretch films. Secondary data sourced from the U.S. Census Bureau, U.S. Department of Labor and Commerce, industry analysts, and investment banking reports, is also included within the Report.
Aspects of the industry examined within the report include:
- Performance (sales, volume)
- Materials and processes (printing, expected material usage)
- End-uses (end-use forecast, U.S. Census Bureau retail segments data - 2010)
- Structure and consolidation (M&A activity)
- Imports and exports (trade outlook)
- Industry vision, challenges, and trends
Over the next few months, the FPA Update will include reviews of key sections within the 2013 Report. Following in this issue is an overview of the “Industry Performance” and “Materials” sections of the Report.
U.S. Flexible Packaging Industry Performance
Growth of the U.S. flexible packaging industry remains positive. Over the past ten years the U.S. flexible packaging industry has grown from $20 billion (in 2002) to $26.7 billion (in 2012) with a compound annual growth rate of approximately 2.9 percent per year. Industry performance compares favorably with the growth of the U.S. economy and revenue and volume growth is projected to continue in 2013. Sixty-six percent of flexible packaging converters expect higher sales and volume in 2013.
The U.S. Flexible Packaging Industry Performance section of the Report also provides information on flexible packaging suppliers’ sales revenue performance, converters’ inventory, profitability, capital spending, the U.S. flexible packaging industry by NAICS 2012, and the global flexible packaging market.
Materials and Processes
Information provided in the Materials and Processes section of the 2013 Report details flexible packaging material purchases in 2012, flexible packaging film and resin use by converters and suppliers, net scrap as a percentage of materials used, manufacturing processing utilized by converters, flexible packaging structures sold, estimated dollar revenue and volume of various flexible packaging formats, printing processes, and expected material usages for the next 3-5 years.
Looking for a reprint of this article?
From high-res PDFs to custom plaques, order your copy today!